The State of Social Media Demographics: 2017 Benchmarks [Infographic]
By f4group, April 12, 2017


Here’s a great little info graphic from our friends at Hubspot, thanks!
There’s quite a bit of information out there to support the claims that people are moving farther away from broadcast television, and closer to the digital realm. And within that landscape, people are straying from their desktops and laptops, and opting to get online via mobile with more frequency.
At least, that’s what the folks at Nielsen and Google have found in their research. As the latter puts it, mobile devices are no longer “secondary,” and people aren’t just using them to get online — they’re using them to get social.
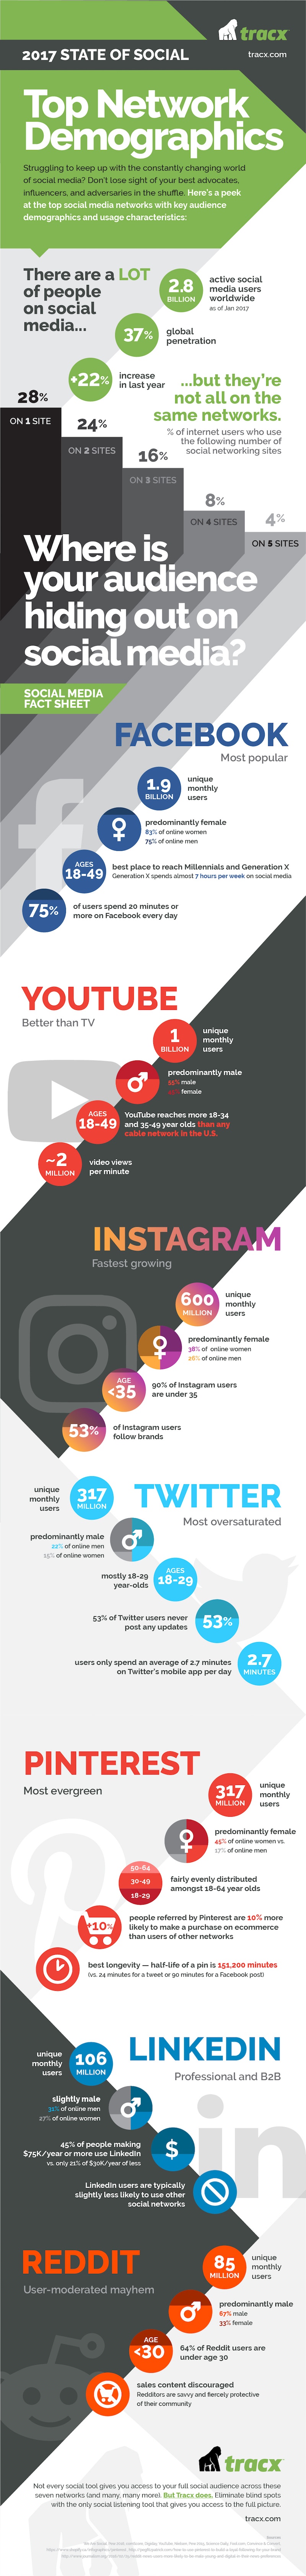
That is, for social media, at least. It’s used by no fewer than 2.8 billion people — which also happens to be the same number of people roaming the planet in 1955. And within that population, many users are on multiple social networks — but who the heck are they, and where, exactly, are they hanging out online?
Manage and plan your social media content with the help of this free calendar template.
When marketers develop their social and mobile strategies — which we strongly encourage you to do, if you haven’t already — these are important questions to ask. After all, you want to reach the right audience. So in addition to determining your buyer personas, you have to know where to find them. Not all of them are going to be using Instagram, for example.
Luckily, our friends at Tracx compiled all of that information into a handy infographic that breaks down the state of social media demographics — who’s using which social network, and for what.
With this information, figuring out how to best reach your personas on social media doesn’t have to be such a daunting task. So read on, and start distributing your content in the right places.
Looking to stay abreast of our latest news and projects?